
Format
DIGITAL - GIS - other
45 record(s)
Type of resources
Topics
Keywords
Contact for the resource
Provided by
Formats
Update frequencies
Status
draft
-
The dataset comprises GIS grids of fishing effort of the Northern Prawn Fishery (NPF) estimated from vessel monitoring system (VMS) data. The VMS is operated by the Australian Fisheries Management Authority (AFMA). It periodically records the location of each vessel in the fishery. Note that the activity of the vessel at the time is not recorded. The system's primary purpose is to monitor compliance with fishing regulations, but the data can also be used for research. To estimate fishing effort from the VMS records, we estimated the track of each fishing vessel by joining successive vessel locations with lines. We divided the track into apparent trawling and non-trawling sections (e.g. based on date, time and vessel speed), and calculated the time each trawling section spent in each cell of a GIS grid covering the managed area of the fishery. This method for estimating fishing effort from VMS data has limitations. Because a vessel may have taken a path other than a straight line between the polls, our straight line path (a) may only partially match the real path of the vessel, (b) may underestimate the length of the path traversed by the vessel, and (c) may underestimate the speed of the vessel. Note that (a) and (b) would affect which particular grid cells the trawling time was allocated to, but not the total trawling time that was added to the grid. The use of vessel speed to filter out non-trawling activity is imperfect because vessels may carry out other activities at speeds less than the maximum trawling speed.
-
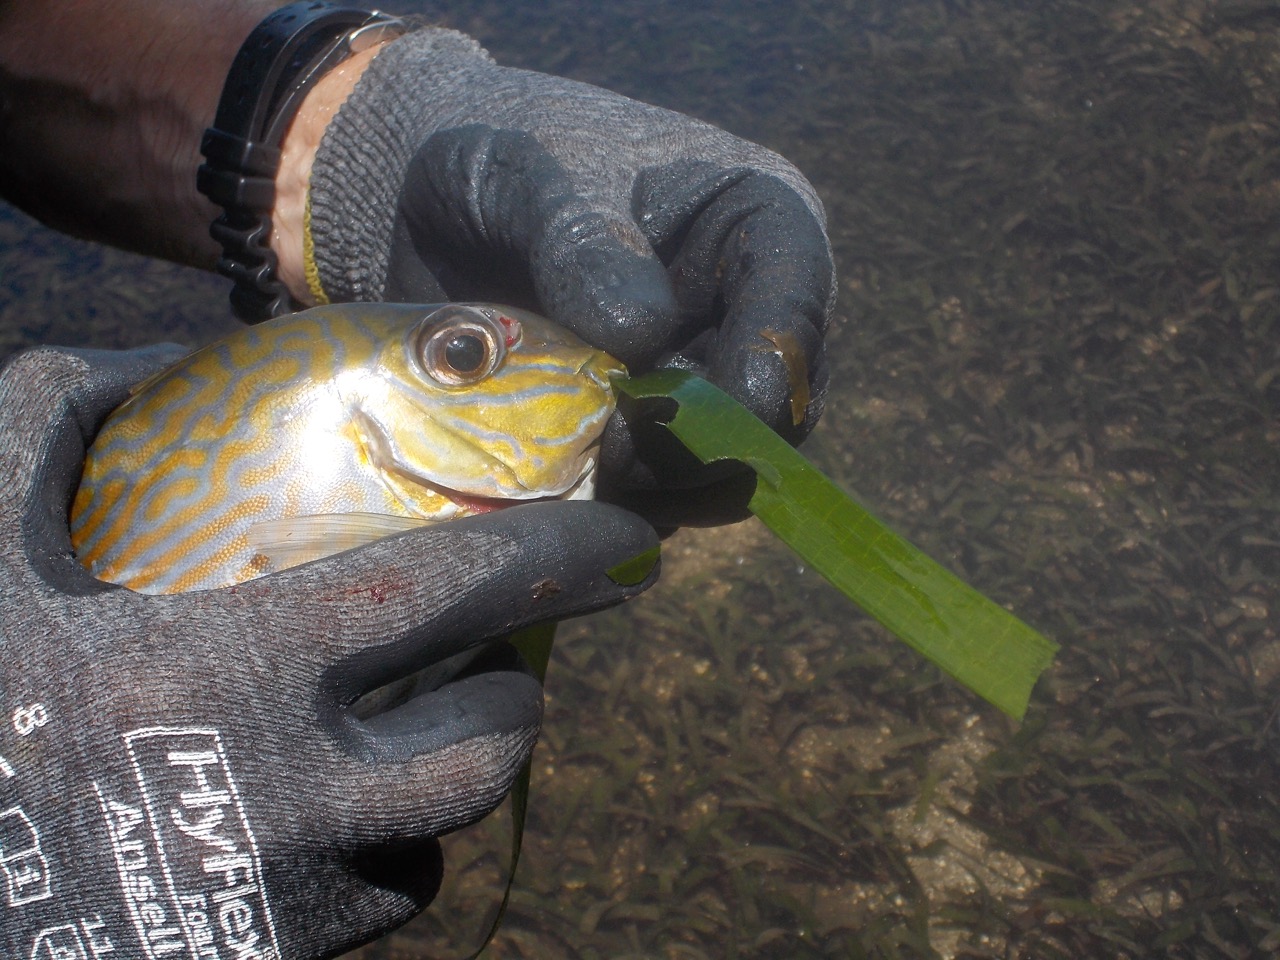
Herbivory is a key ecological process that sustains food webs, and can regulate the biomass of primary producers in an ecosystem. It has long been hypothesized that rates of herbivory are greatest in the tropics, although strong evidence to support this is limited. The aim of this project was to identify the key species of herbivores, to identify the grazing rates of key herbivores, and in conjunction with project WAMSI 2 KMRP Project 2.2.4 (benthic primary productivity) provide estimates of the proportion of production that is consumed by herbivores. The research on herbivory was focused on the islands and coast of the Bardi Jawi Indigenous Protected Area in the Kimberley (Western Australia), encompassing Jalan (Tallon Island) and Iwany (Sunday Island). Focus of the herbivory study was on one type of habitat (seagrass meadows), and the diet of two species of herbivores (golden-lined rabbitfish and green turtle). Four surveys were conducted between October 2014 and April 2016. At these locations the following measurements or collections were made (not all measurements were made during each survey): (1) Rates of herbivory (three surveys). These data are presented in the report for WAMSI KMRP 2.2.4, here the focus is on assessing rates of herbivory as a proportion of primary production; (2) Collections of golden-lined rabbitfish (Siganus lineatus); and (3) Blood samples from green turtles (Chelonia mydas). Ten green turtles were tagged with satellite tags: 4 in April 2015, and 6 in April 2016. This data record only pertains to data held by CSIRO. For access to all other data generated by collaborative research partners of the KMRP 1.1.2 project refer to the additional metadata field.
-
ESRI grid showing wave height and period using satellite derived wave data generated from the Australian Bureau of Meteorology's Wave Model (WAM). This grid has been produced by CSIRO for the National Oceans Office, as part of an ongoing commitment to natural resource planning and management through the 'National Marine Bioregionalisation' project. Data from National Geophysical Data Centre (NGDC) has been supplemented where loss of coverage has occurred in the deep ocean regions.
-
Set of three ESRI grids of mean sea surface height derived from annual and semi-annual temperature and salinity cycles stored in CARS2000. CARS is a set of seasonal maps of temperature, salinity, dissolved oxygen, nitrate, phosphate and silicate, generated using Loess mapping from all available oceanographic data. It covers the region 100-200E, 50-0S, on a 0.5 degree grid, and on 56 standard depth levels. Higher resolution versions are also available for the Australian continental shelf. The data was obtained from the World Ocean Atlas 98 and CSIRO Marine and NIWA archives. It was designed to improve on the Levitus WOA98 Atlas, in the Australian region. These grids have been produced by CSIRO for the National Oceans Office, as part of an ongoing commitment to natural resource planning and management through the 'National Marine Bioregionalisation' project. Variations in onscreen colour representation or printed reproduction may affect perception of the contained data.
-
ESRI shape file showing ocean upwelling around Australia. This shape file was produced from a hand drawn map showing upwelling around Australia. The hand drawn map is a qualitative summary of published information on upwelling. The shape file has been produced by CSIRO for the National Oceans Office, as part of an ongoing commitment to natural resource planning and management through the 'National Marine Bioregionalisation' project. Data shown is qualitative.
-
ESRI grids showing half lunar mean and maxium tidal currents for the Australian Shelf. The tide data was generated from a tide model for the Australian Shelf which was set up for the region limited by 0 degrees S to 45 degrees S and 109 degrees E to 160 degrees E. The spatial and temporal resolution of the model output is 0.067 degrees in both latitude and longitude and half a lunar cycle respectively. The arc info grided data was generated by Rick Smith and mapped by Donna Hayes.
-
ESRI grid of mean sea surface currents derived from annual and semi-annual temperature and salinity cycles stored in CARS2000. CARS is a set of seasonal maps of temperature, salinity, dissolved oxygen, nitrate, phosphate and silicate, generated using Loess mapping from all available oceanographic data in the region. It covers the region 100-200E, 50-0S, on a 0.5 degree grid, and on 56 standard depth levels. Higher resolution versions are also available for the Australian continental shelf. The data was obtained from the World Ocean Atlas 98 and CSIRO Marine and NIWA archives. It was designed to improve on the Levitus WOA98 Atlas, in the Australian region. These grids have been produced by CSIRO for the National Oceans Office, as part of an ongoing commitment to natural resource planning and management through the 'National Marine Bioregionalisation' project. Variations in onscreen colour representation or printed reproduction may affect perception of the contained data.
-
ESRI grids showing nitrate, linearly interpolated from CARS2000 mean and seasonal fields to 0.1 degree spaced grid, at depths of 0, 150, 500, 1000 and 2000 metres. The loess filter used to create CARS2000 resolves at each point a mean value and a sinusoid with 1 year period (and in some cases a 6 month period sinusoid - the "semi-annual cycle".) The provided "annual amplitude" is simply the magnitude of that annual sinusoid. CARS is a set of seasonal maps of temperature, salinity, dissolved oxygen, nitrate, phosphate and silicate, generated using Loess mapping from all available oceanographic data in the region. It covers the region 100-200E, 50-0S, on a 0.5 degree grid, and on 56 standard depth levels. Higher resolution versions are also available for the Australian continental shelf. The data was obtained from the World Ocean Atlas 98 and CSIRO Marine and NIWA archives. It was designed to improve on the Levitus WOA98 Atlas, in the Australian region. CARS2000 is derived from ocean cast data, which is always measured above the sea floor. However, for properties which do not change rapidly near the sea floor, this would not lead to a significant error. All the limitations of CARS2000 also apply here.
-
ESRI grid and shape files showing Wind Stress on Australia's oceans from data supplied by the National Centers for Environmental Prediction (NCEP) Re-analysis Project, 1976 to 1998 inclusive. These grid and shape files have been produced by CSIRO for the National Oceans Office, as part of an ongoing commitment to natural resource planning and management through the 'National Marine Bioregionalisation' project. Variations in onscreen colour representation or printed reproduction may affect perception of the contained data.
-
ESRI grid showing ocean primary production extracted from global observations of ocean colour data from the moderate resolution imaging spectroradiometer (MODIS). This grid has been produced by CSIRO for the National Oceans Office, as part of an ongoing commitment to natural resource planning and management through the 'National Marine Bioregionalisation' project. Chlorophyll accuracy is about ± 20%.